A phase accumulator is a way to generate sine waves. If you are not having problems, a simpler approach might be better.
Here’s a way to generate a two-second 600 Hz tone without using a phase accumulator.
RATE = 8000 # Sample rate
FREQ = 600  # Target frequency

for n in range(RATE * 2): # 2 seconds
    t = n / RATE # Current time
    s = math.sin(FREQ * 2.0 * math.pi * t)
    output_sample(s)
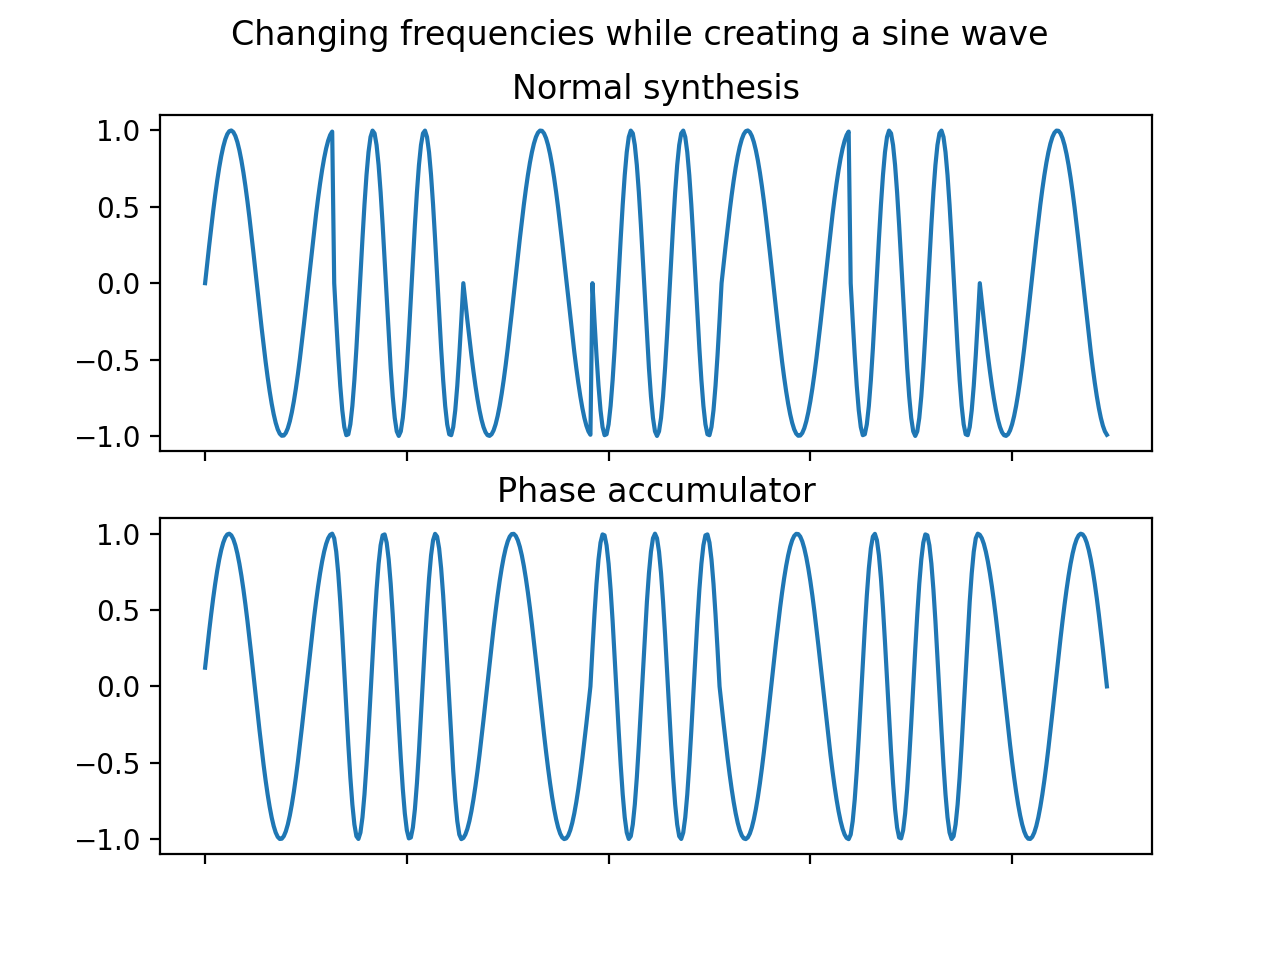
This works perfectly fine when you are not changing the frequency quickly. But if you do, you will notice that the output sound has some clicks or pops every time the frequency changes. For something like Frequency Shift Keying, a cleaner output can be achieved by using a phase accumulator.
Here’s a simple implementation of a phase accumulator.
RATE = 8000
FREQ = 600

phase = 0.0
for _ in range(RATE * 2):
    phase += 2.0 * math.pi * FREQ / RATE
    s = math.sin(phase)
    output_sample(s)
The figure below shows the difference between the two methods, and highlights the problem with the simple method.
The plot was generated with the following code
#!/usr/bin/env python
import matplotlib.pyplot as plt
import math

RATE = 256

normal_samples = []
phase_samples = []

phase = 0.0

n = 0
for freq in [5, 10, 5, 10, 5, 10, 5]:
    for _ in range(int(RATE / 4)):
        phase += 2.0 * math.pi * freq / RATE
        phase_samples.append(math.sin(phase))

        s = math.sin(2.0 * math.pi * freq * (n / RATE))
        normal_samples.append(s)
        n += 1

fig, ax = plt.subplots(2)
fig.suptitle("Changing frequencies while creating a sine wave")

ax[0].title.set_text("Normal synthesis")
ax[0].plot(normal_samples)
ax[0].set_xticklabels([])
ax[1].title.set_text("Phase accumulator")
ax[1].plot(phase_samples)
ax[1].set_xticklabels([])

plt.savefig("plot.png", dpi=200)
